Chart
Under the History tab of a task, you can draw time charts to analyze recent task execution data such as response time, response code, and JSON data in response body.
Examples
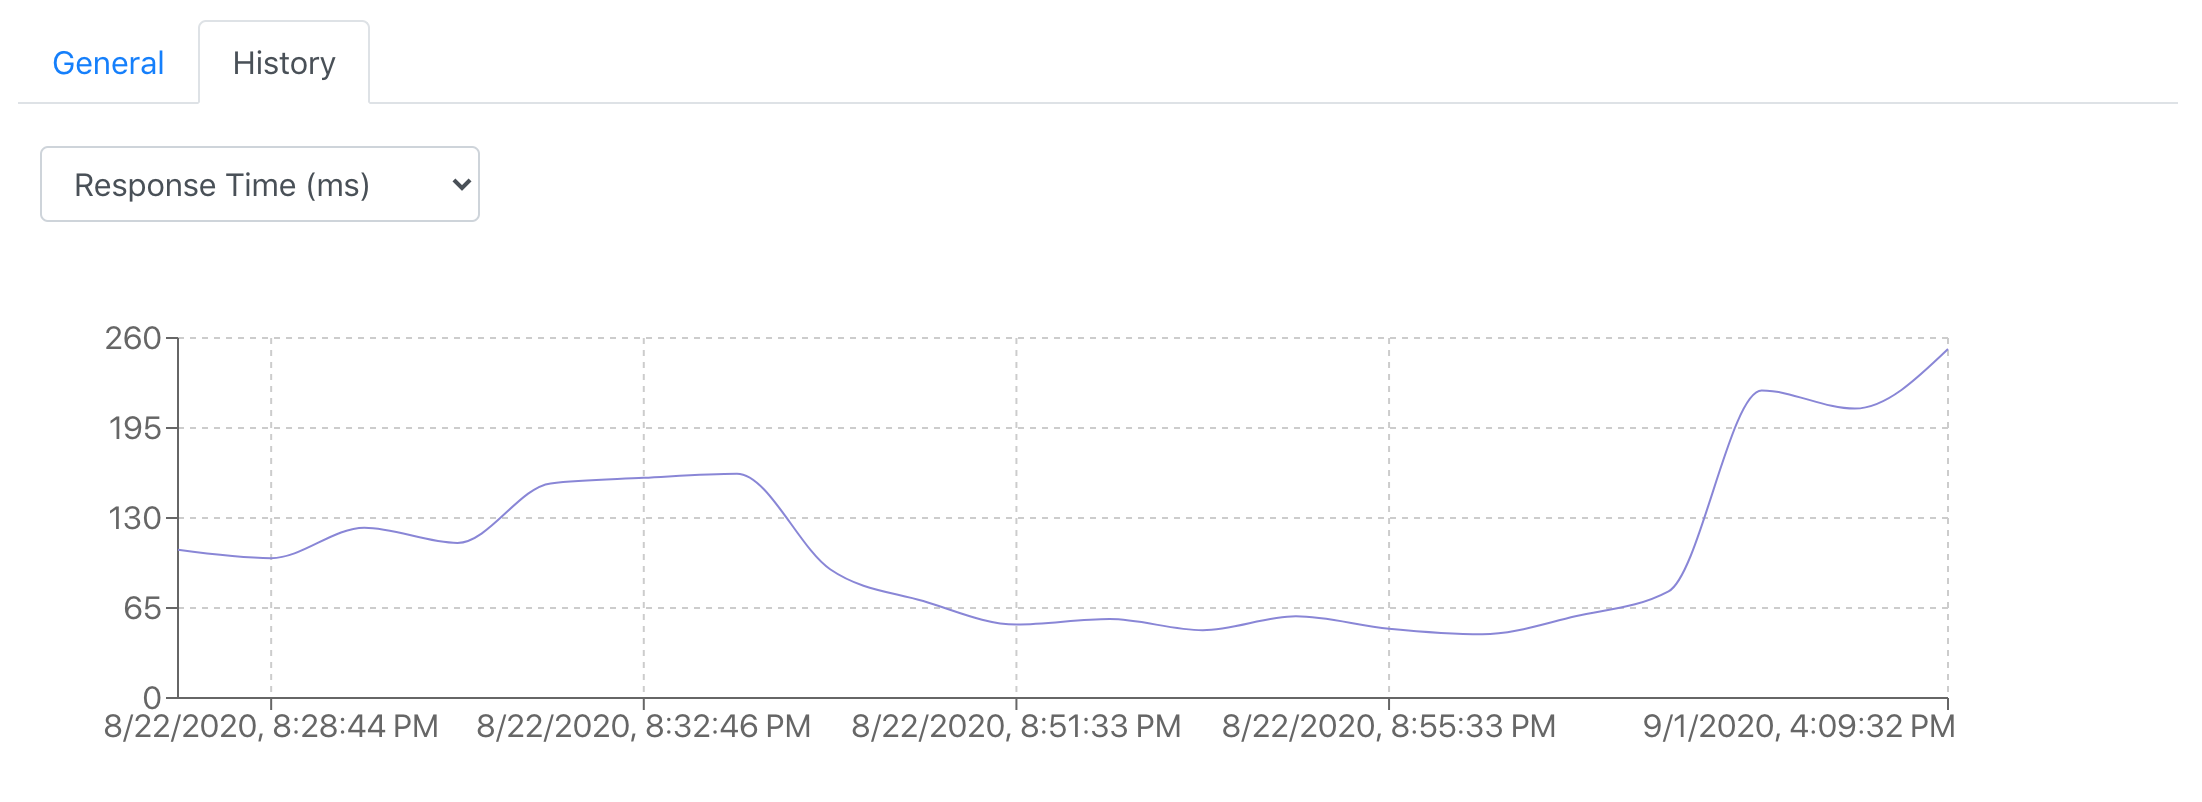
1. Response Time
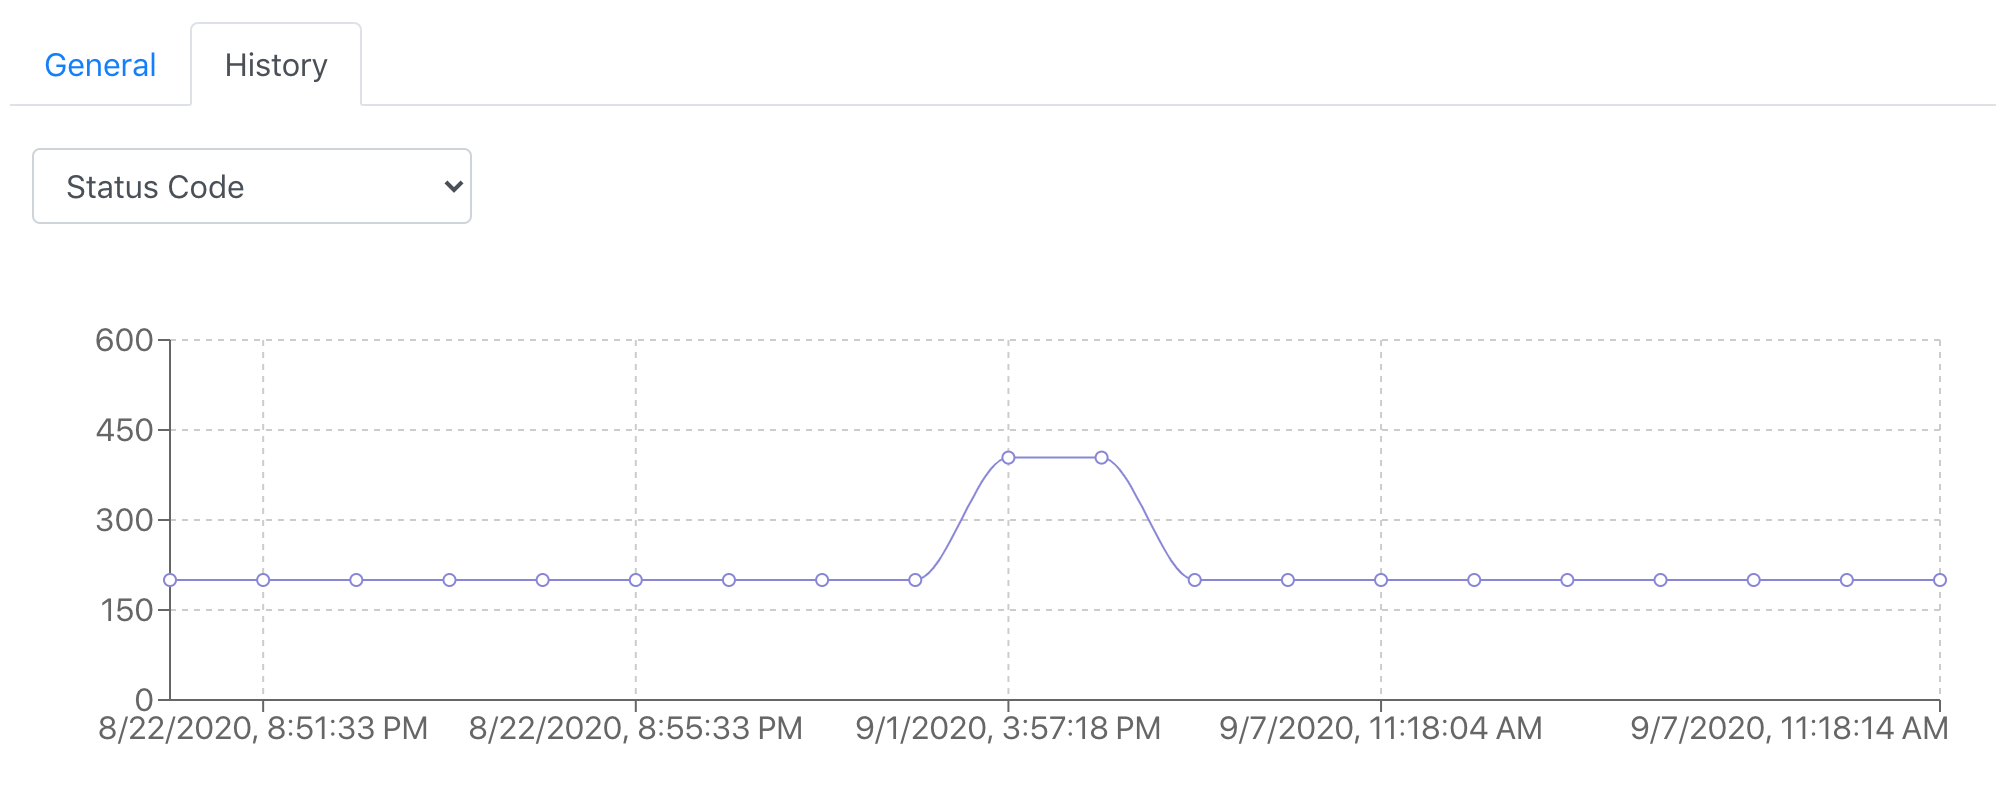
2. Status Code
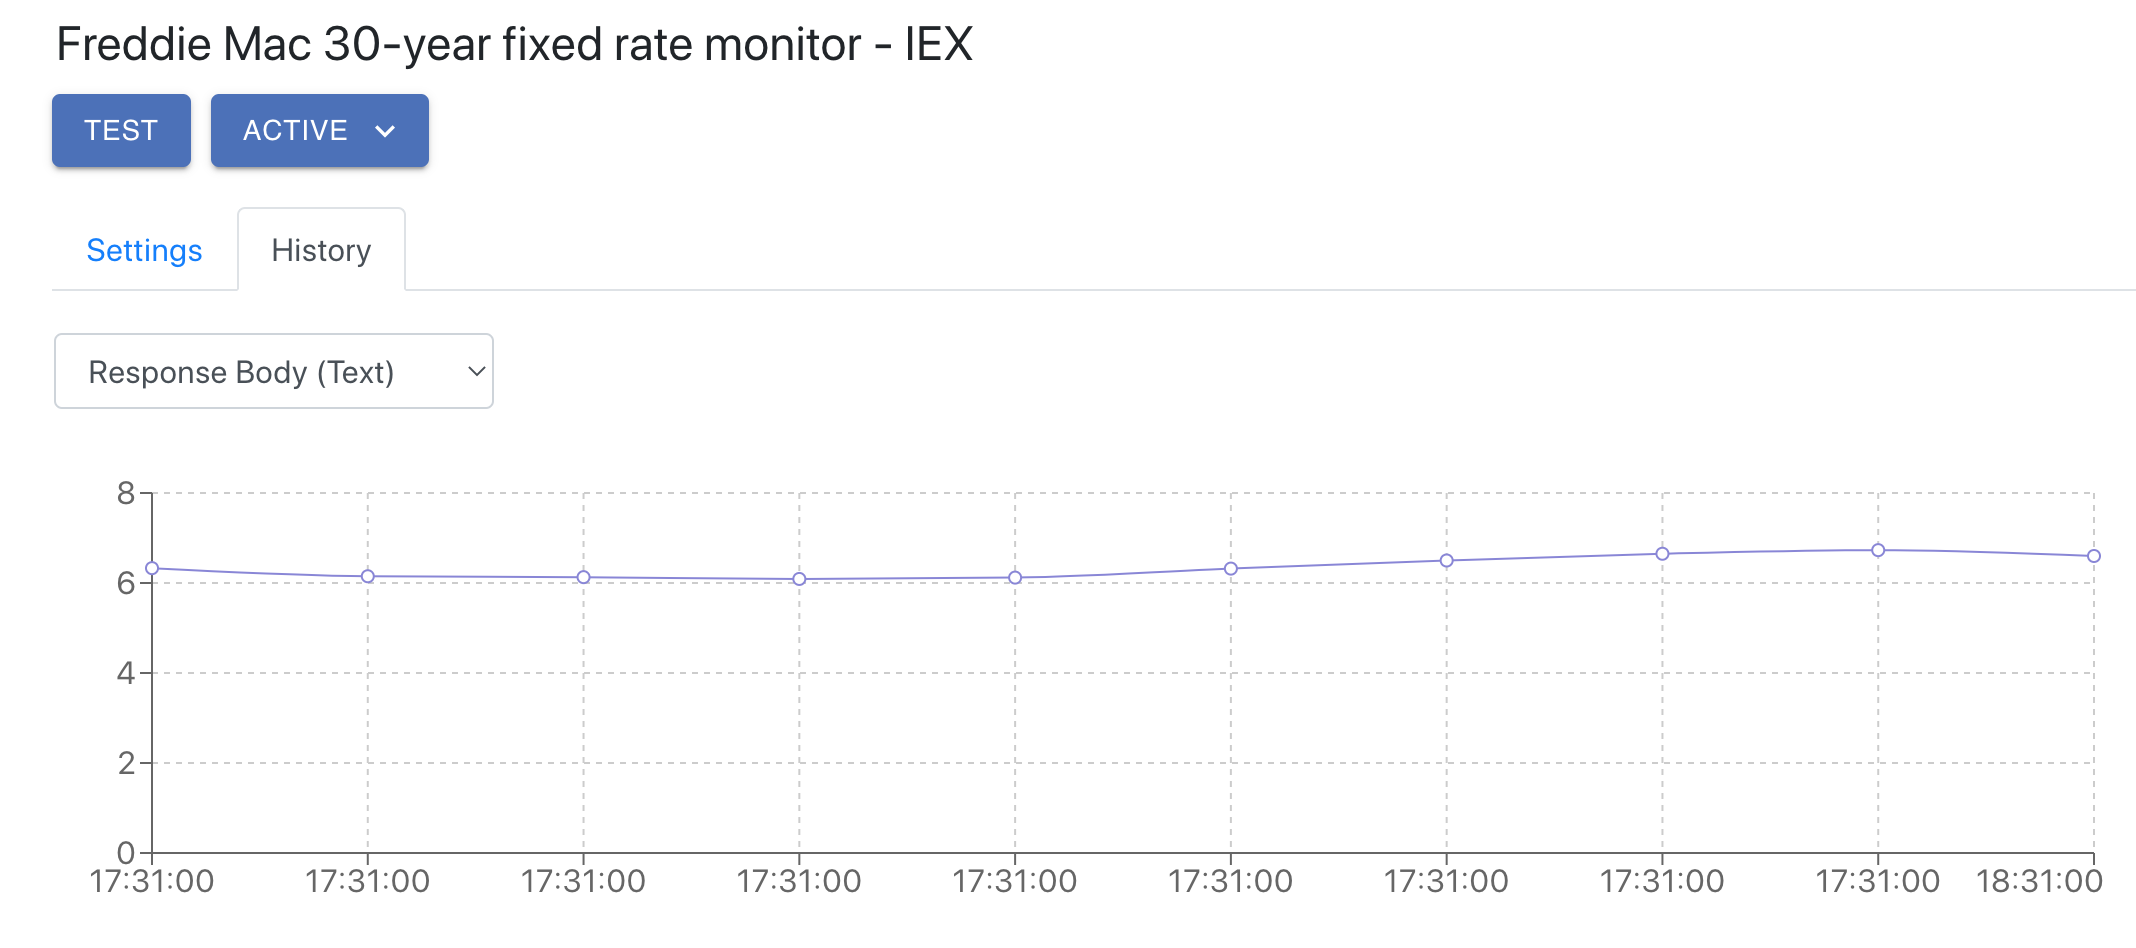
3. Response Body Text
If the entire response body is a numeric value, you can use this option to visualize the data among recent task executions. Below is an example of the IEX Freddie Mac 30-year fixed rate API response:
6.6
A chart of the response body text for the last 10 executions will look like:
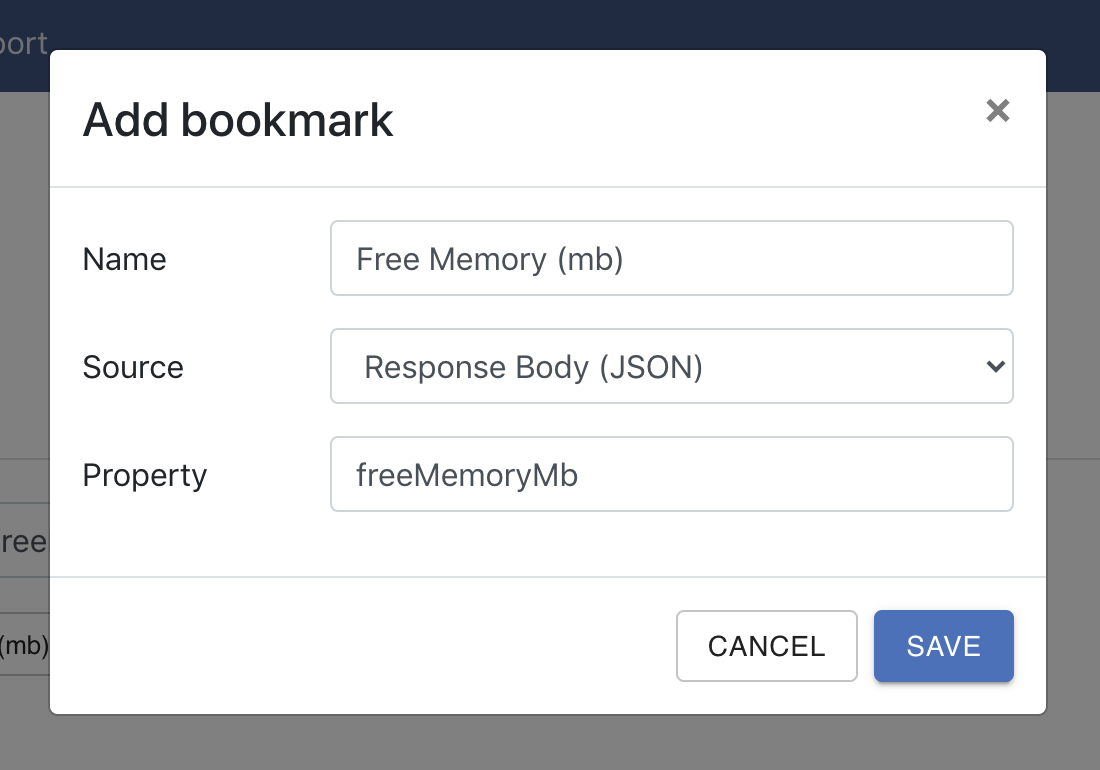
4. Property in Response Body
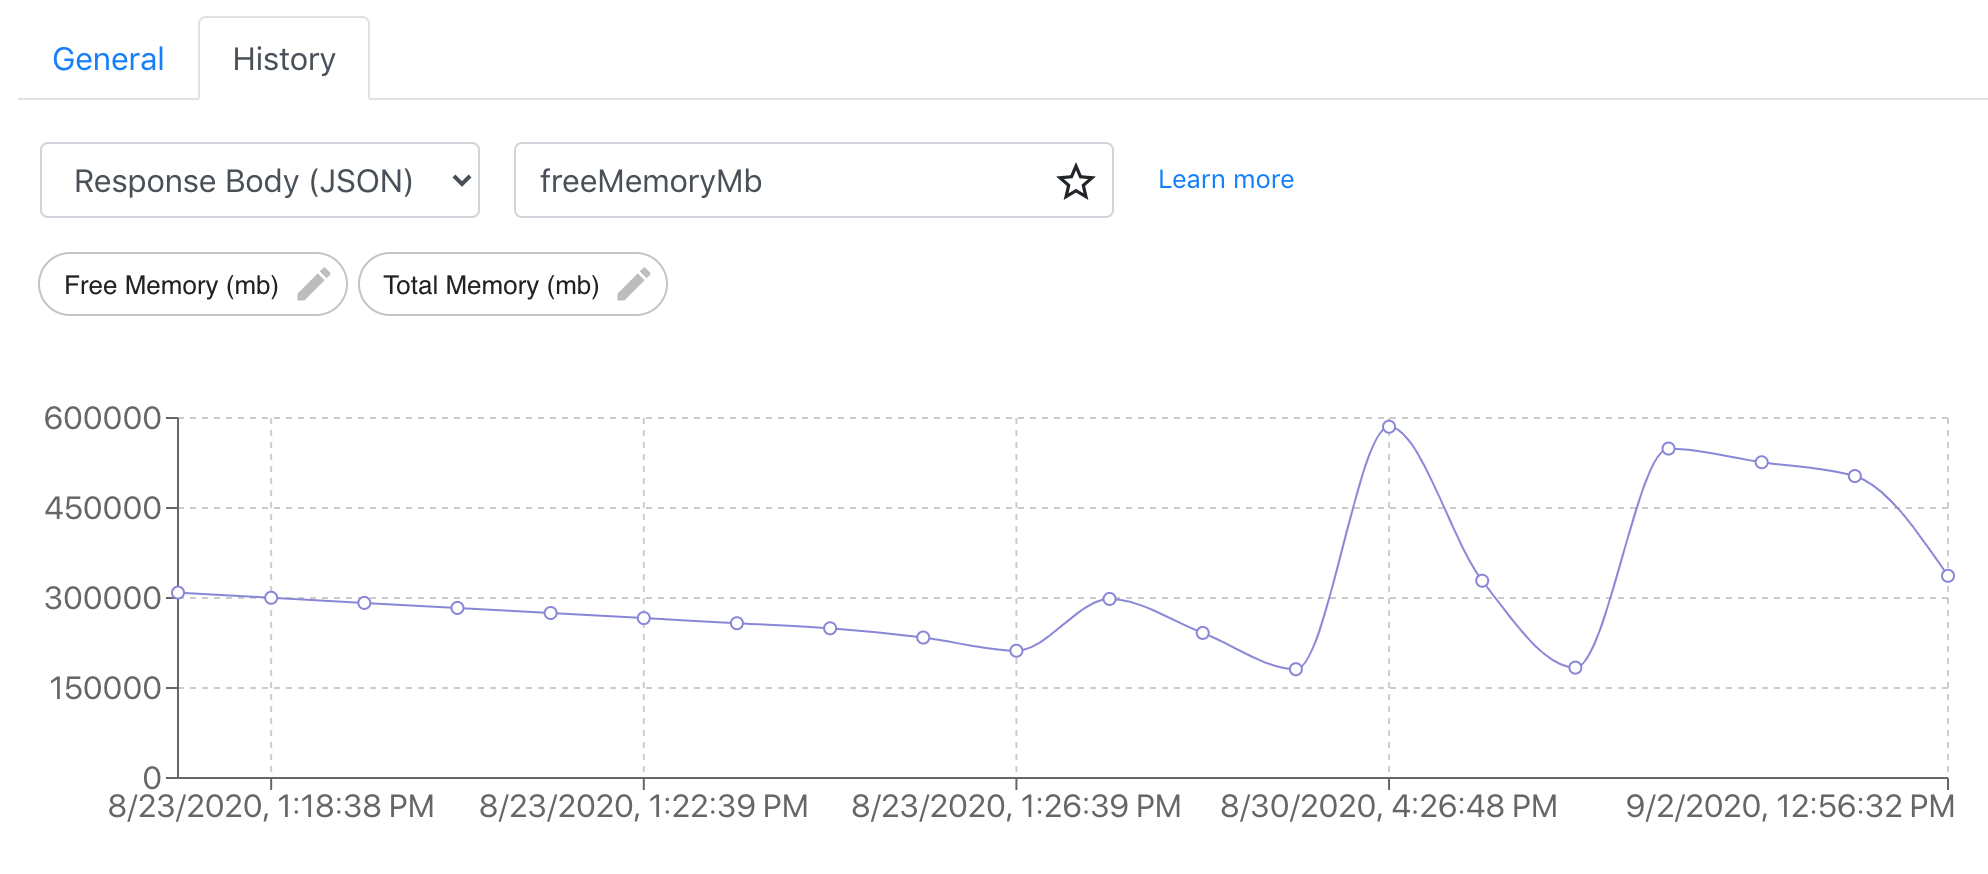
To analyze JSON response body properties, you can use JSON path expression to specify a property of your interest. Let's say we have a system memory monitor task that returns the following JSON response body:
{
    "totalMemoryMb": 370688,
    "freeMemoryMb": 241774
}
Enter freeMemoryMb in search box, you will get free memory chart for the current page of task executions.
Note that right now JSON path expressions only apply to response body in JSON format.
Bookmark
For frequently examined JSON expressions, you can create bookmarks for future access. Click the star icon at the right of search box, you will see a dialog to enter bookmark name, and then click SAVE, a chip will appear under the search box, which you can click on to re-generate the chart.